 &imagePreview=1
Written by Luca Csanády / Posted at 10/21/22
aiMetrics - Insights into the performance of your automated driving software
aiMotive has developed a comprehensive tool for evaluation of NN algorithms, detection SW and automated driving software. It tracks development progress against requirements and provides real-time insights and gap analysis.
Overview
aiMetrics contains two major parts, each tailored to distinct verification phases of AD SW development:
- Software Module Metrics: for testing the functions (SW module output) of AD SW, e.g., for measuring NN or downstream SW module performance (trajectory, control, etc.)
- Test Metrics: for testing AD SW performance from a holistic perspective, e.g., against various EURO NCAP criteria
Both parts are used for running post-process metrics, using recordings or simulation data. Functions relying on neural networks generally use relative-reference metrics to compare AI versions; whereas standards (e.g., EuroNCAP, ISO LCDAS, ISO LDW) require absolute-reference metrics to compare behavior to well-defined requirements.
Software Module Metrics
Software Module Metrics is a framework for calculating benchmarks for any SW module of AD SW. By benchmarks, we refer to any calculations where the characteristics of a SW module are measured by performing some comparison between the output of the module and the expected 'perfect' output.
Software Module Metrics serves two main use cases:
- Creating benchmarks: high-level overview of the characteristics of a module, usually by aggregating the results from many recordings, and analyzing average or worst-case performance. The typical outputs are tables and plots.
- Creating tests: analyze the characteristics of a SW module, usually in a smaller number of targeted situations, and warn if certain conditions are violated. Typically, this is done on simulated scenarios or readback sessions, and the expected final output is a pass/warn/fail value that can be used for deciding whether the given module reaches the expected quality
A wide range of benchmarks can be covered with this solution, such as metrics related to object detection and tracking, lane detection and road representation, free space, longitudinal and lateral control, egomotion, and so on. The modularity of the framework also allows for easy expansion to new metrics.
Benchmarking process
All benchmarks share the same general structure/basic steps.
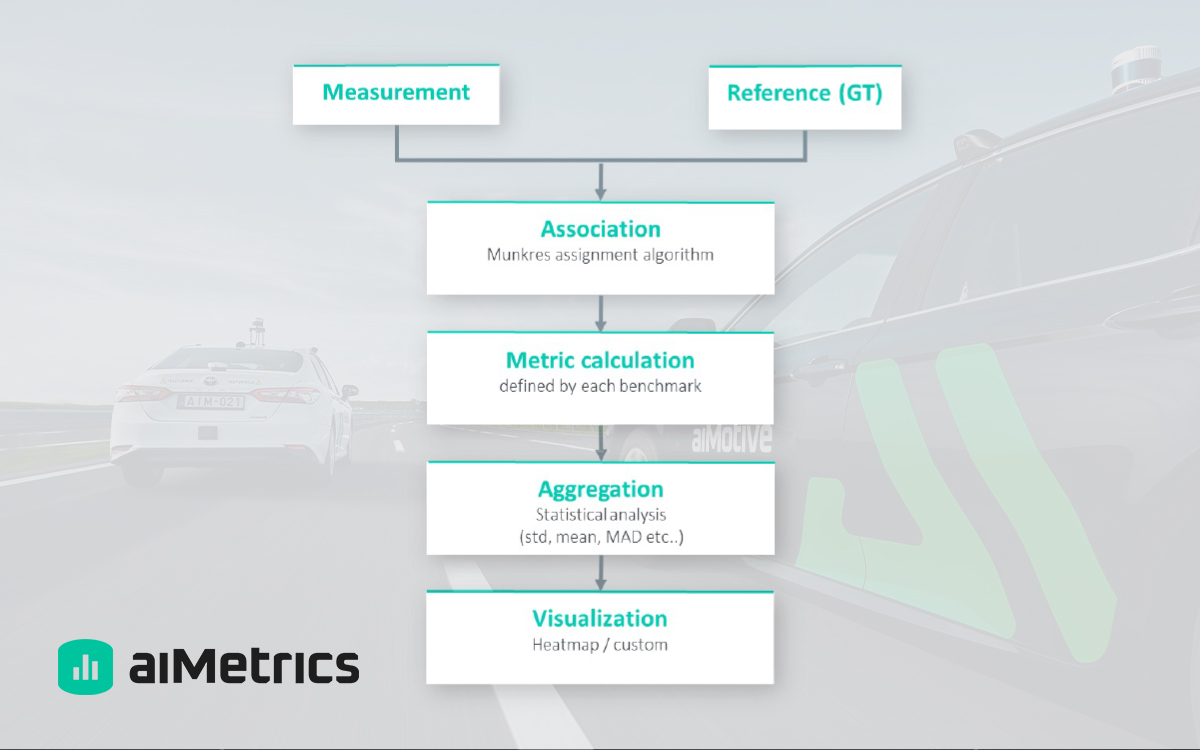
First, the reference and measurement data are loaded into the system.
The framework assumes that its output can be described as a set of observations at given time points. For example, a typical observation in the case of an object tracking benchmark is a single vehicle seen at a single moment.
Then, association is performed between the reference and measurement data. Association means value and timestamp-based dataset concatenation, synchronizing: Finding the best match between the observations found in the reference and measurement, subject to some constraints.
If the reference and measurement data are generated at the same time, their values are comparable. This happens, for example, when comparing the output of a module with the GT output for the same module generated by the simulator. If the times in the two information sources do not match perfectly (e.g., because reference data is generated by sensors running at different frequencies, such as lidar vs camera), then timestamp matching and interpolation may also be necessary as part of the association.
After the association, we calculate association metrics: TP, FP, FN. Then, we can move on to generate a wide variety of metrics, including aggregated ones, so that the long list of individual observations is turned into a few numbers that provide an overview of the data.
Typical aggregations include position-based mean values of local detection error for calculating the overall/global score of the average value, or max e.g.: for getting the largest error seen in the whole data set.
As a final step, visualization is used for making the data easily interpretable. The most common plot currently provided by the framework is grid-like, where each grid cell contains an aggregated value of all the observations that fall into that relative position range.
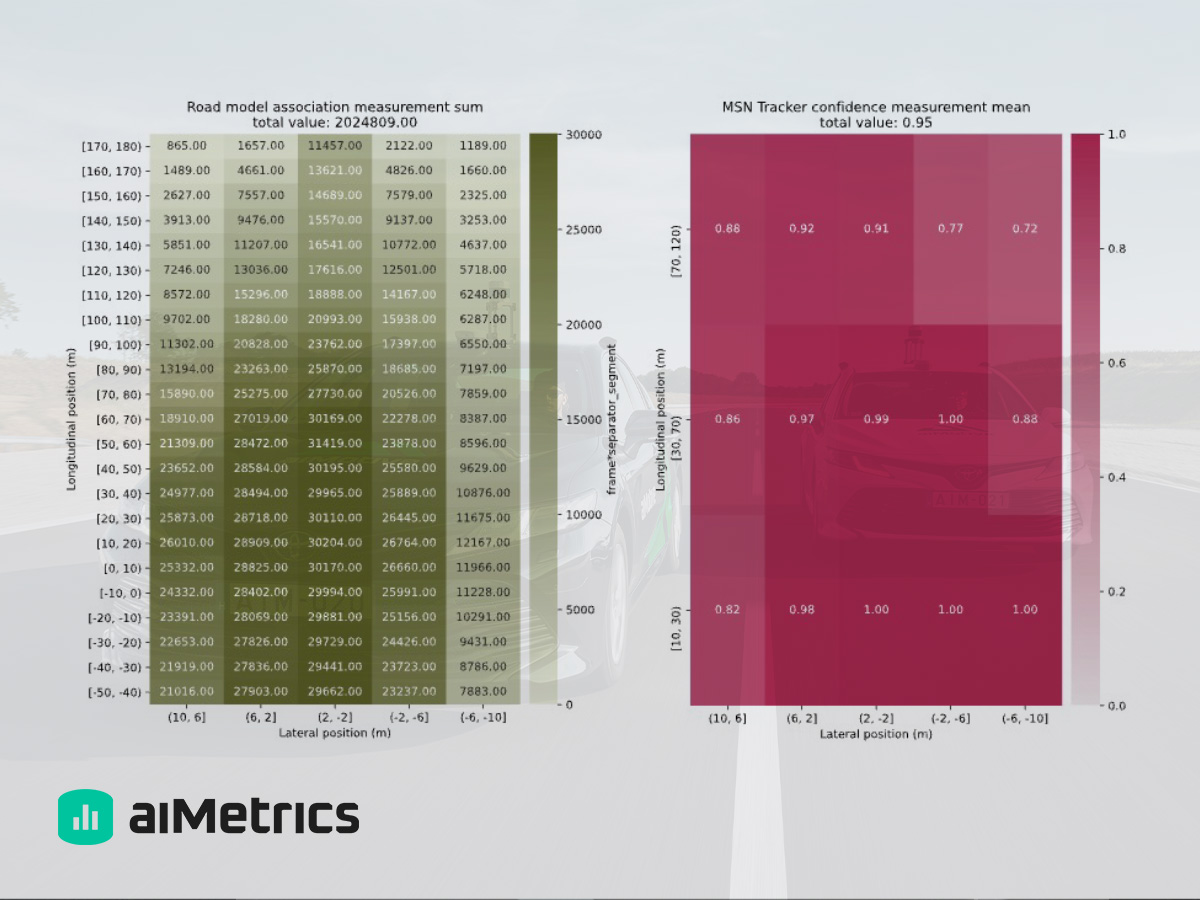
Sample visualization of Software Module Metrics
Test Metrics
Test Metrics is generally described as an absolute-reference metric tool set. The term ‘absolute-reference’ means that the reference dataset or thresholds are strictly defined externally (e.g.: in ISOs), therefore the GT should never be dependent on ill-defined or relative output of experimental sensor sets (unlike in Software Module Metrics, where sometimes AI evaluation for development purposes welcomes this idea). It can be used for verifying threshold values and fast problem source identification. It can generate flags for sequences, and includes an interactive platform for visualization, allowing for easy human interpretation of the data.
Currently, the following types of metrics are included in this category:
- Acceleration regulator: for spotting over-regulated speed changes
- AEB: for supporting AEB characterization in terms of slew rate and first-time detection distance
- Disengagement metrics: for creating metrics on the defined disengagement types for AD SW (e.g., LKA oscillation, ACC catch-up.)
- EuroNCAP: metrics for ADAS functions included in EURO NCAP 2020 safety assessment criteria (i.e.: AEB, speed assist, lane support systems)
- HMI reader: metrics for signal-level communication with the HMI controller ECU of a test vehicle
- LCDAS: for visualizing calculated LCDAS events based on ISO 17387:2008
- Simulation metrics: post-process metrics for evaluating simulated scenario executions against defined safety conditions, e.g., safety gaps, acceleration/deceleration, jerk, oscillation, etc.
- Surround tracking: for catching sudden vehicle appearance or disappearance within the subject vehicle's region of interest
- Time statistics: for examining runtime efficiency of AD SW modules and their violation of the tolerated time interval for execution (in milliseconds)
- Trajectory comparator: for evaluating the subject vehicle's steering curve compared to the curvature of the road spline at different speed limits
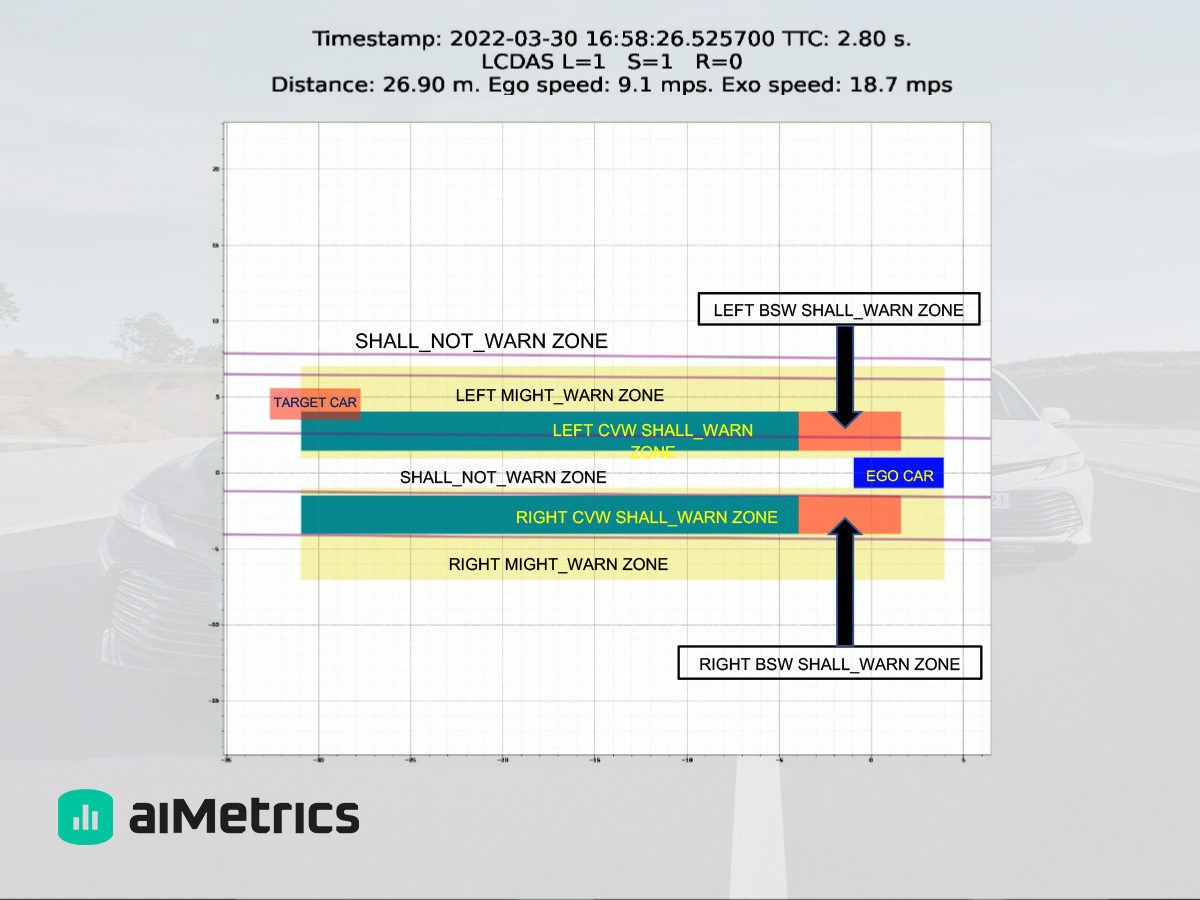
Sample visualization of a Test Metric
Outlook
aiMetrics is a comprehensive yet easily adaptable and extendable tool to gain insights into the performance of your AD SW at various levels during development.
This concludes the blogpost series about our data processing pipeline, aiData. I hope that we were able to give you a good overview of our solutions, as well as some thought-provoking ideas.
We are happy to answer any further questions about our tools, so please feel free to reach out to us via email:
- [email protected] for European inquiries
- [email protected] for North American inquiries
- [email protected] for Japanese inquiries
- [email protected] for APAC inquiries
